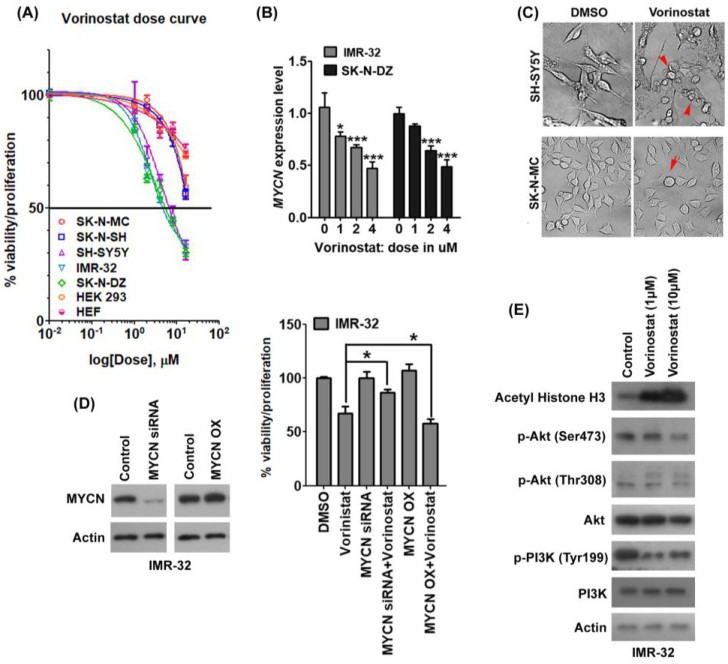
Fig. 6. Vorinostat was more effective in MYCN overexpressors. (A) Neuroblastoma cells were treated with different (0 to 16 µM) doses of vorinostat and the relative percentage of viability with proliferation were calculated by following the formula: % viability, proliferation = (optical density (OD) of the drug-treated sample/OD of the control sample) × 100. The values were plotted in log scale and curve-fit was obtained by GraphPad Prism 5. (B) RNA expression of MYCN was examined in IMR-32 and SK-N-DZ cells by qPCR after vorinostat treatment at different concentrations and normalized with GAPDH as a loading control. The histogram was plotted by GraphPad Prism 5. (C) Cellular morphology was examined after vorinostat (2 µM) treatment of the neuroblastoma cells. Photographs were imaged with an inverted microscope at 40X magnification. The red arrows are indicative of apoptotic cells. (D) IMR-32 cells were transfected with siRNA and an overexpression vector of MYCN (MYCN OX) and then treated with vorinostat (2 µM) for 24 h. Expression of MYCN was evaluated by Western blot. The cell viability/proliferation assay was performed and the relative percentages of viability with proliferation were calculated and plotted as a histogram with GraphPad Prism 5. (E) Expressions of acetyl-histone H3, p-Akt (Ser473 and Thr308), Akt, p-PI3K, and PI3K were examined by Western blot after administration of different doses of vorinostat for 24 h. Actin was used as the loading control.